Inspiring Curiosity in Weather and Climate
Inspiring Curiosity in Weather and Climate
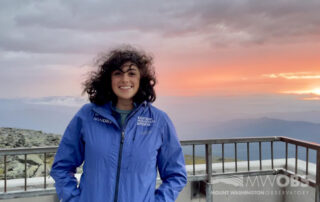
2021-12-14 21:04:14.000 – Jacquelyn Bellefontaine, Weather Observer & Education Specialist
One of my favorite parts of the week occurs on Tuesdays at 11:15 am, when our Home of the World’s Worst Weather Live! program takes place. This free virtual classroom series was developed in 2020 as a way for young students (and any life-longer learners!) to engage with Mount Washington Observatory staff as we present on a variety of weather and climate topics.
The program was met with great enthusiasm from school systems as well as the general public, and it has become something the Observatory’s Education Specialists look forward to with great anticipation each week. The 2021-22 series is my first full season delivering the programs since I started as a Weather Observer and Education Specialist last March.
Funny enough, Home of the World’s Worst Weather Live! played a major role in inspiring me to join the summit staff. Before becoming an Observer, I was a summit intern learning about our summit operations and shadowing other Observers. I quickly became curious about the educational outreach that the Education Specialist at the time, Nicole Tallman, participated in, and I began to assist her in developing program materials. I was then able to co-present on one of the programs, which further sparked my interest in science education, and the rest is history!
I very much enjoy developing and presenting our weekly virtual classroom programs. Some of my favorite topics that we have covered so far (from the past and current seasons) include Wind Patterns, Cryosphere-Atmosphere Interactions, Our Changing Cryosphere & Hydrosphere, Timeline of Global Climate, and Climate Change Solutions.
My background is in Climate Sciences, and I have a particular interest in our cryosphere (all the ice on Earth!), so it makes me incredibly grateful to have the opportunity to teach others and inspire excitement about the science that excites me! What is even more exciting is seeing young students really engage with the material and ask fantastic questions about Earth’s weather and climate systems. Their curiosity is inspirational.
I’m looking forward to the upcoming programs, and if you’d like to join me (and Education Specialist Stephen Durham), check out mountwashington.org/classroom for the Zoom registration. Hope to see you there!
Jacquelyn Bellefontaine, Weather Observer & Education Specialist


 Cirque glaciers erode and deepen the hollows by subglacial plucking and abrasion.
  Lakes of the Clouds (tarn) on the south side of Mt Washington