Temperature:      Wind Speed:      Gust:      Wind Chill:      Direction:    Switch to Metric

March 2022

A Night in the Life of a Weather Observer

A Night in the Life of a Weather Observer

By Charlie Buterbaugh | March 15, 2022

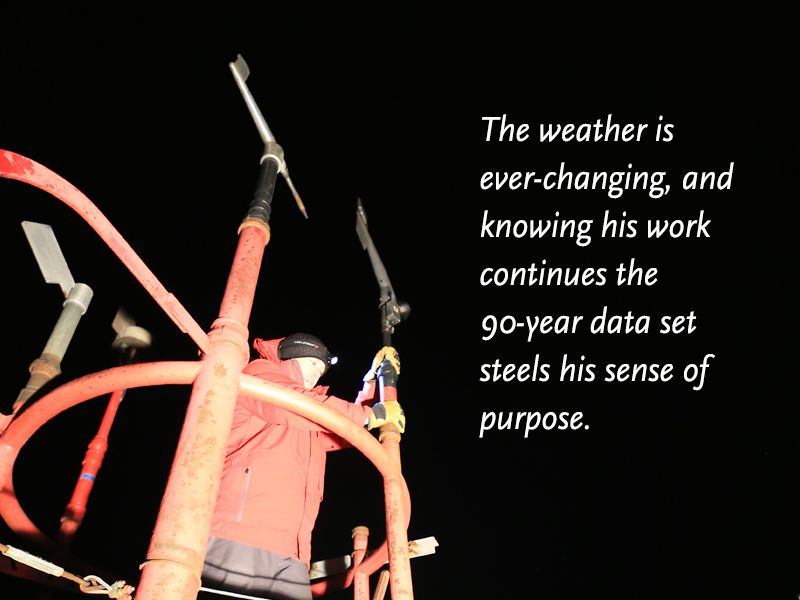
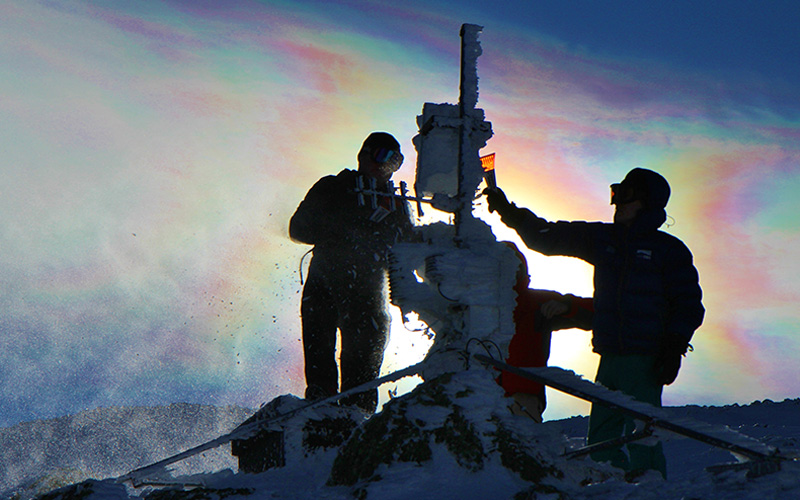
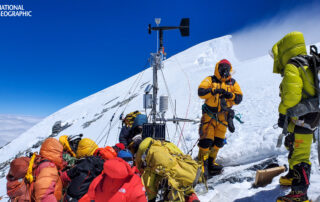
Staff Meteorologist Ryan Knapp sets an anemometer on the observation tower.

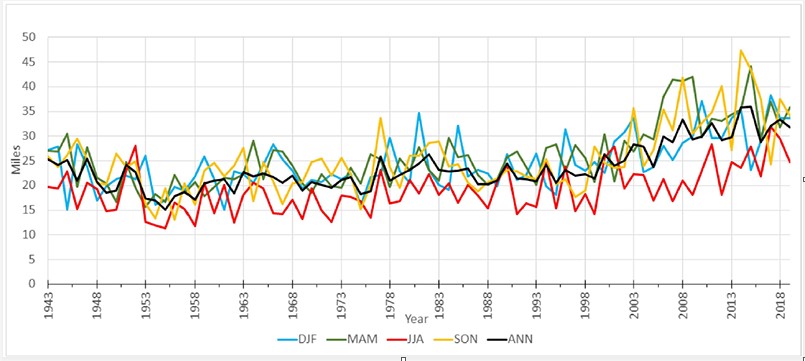
Well over a mile above the valley of Mount Washington, in a weather station built into boulders deposited tens of thousands of years ago, a night observer keeps track of data through the night, maintaining one of North America’s longest continuous alpine climate records.
He is mainly focused on the minutes, completing observations between 00:49 and 00:59 past every hour. Routine and process rule the night, but no two nights make the same weather. The consistency of process, timing, and location assure continuation of a 90-year data set. Weather presents a far less reliable dimension, especially on Mount Washington, where cycles are shaped by cold fronts, warm fronts, and extreme conditions that arrive as they please.
It’s 5:30 p.m. on a mid-November Tuesday evening, and Staff Meteorologist Ryan Knapp seems accustomed to darkness, keeping the weather room dimly lit. He relieves the two day observers whose work started 12 hours ago. The transition between staff is critical. They compare notes about current conditions and forward-looking models.
“If you don’t write something down, it could quickly become too little too late,” says Knapp. “Weather systems could be arriving hours ahead of what the models are saying.”
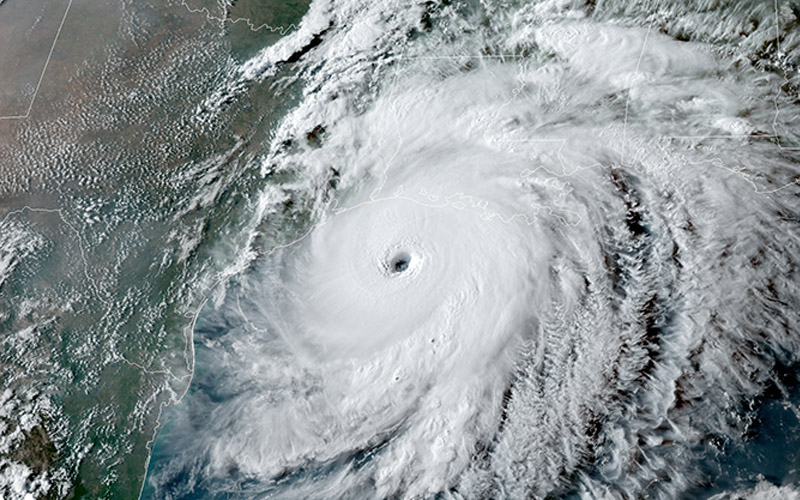
His running analysis combines real-time observations at the summit with data charts and weather maps displayed on multiple screens. Tonight, a low-pressure system approaching from the northwest pushes dry air like a bulldozer, creating pockets between moist layers.
The meteorologist checks data quality, verifying figures entered during the prior day to keep a clean baseline. In addition to the nightly checks, the team circles back to assure quality each morning, then again every five days, and once more at the end of the month.
“That’s what goes into our 90-year record,” says Knapp, referring to the monthly review.
Before the next ob, we head downstairs for dinner in the crew’s living quarters. Seated at a long table, eating sautéed vegetables and pizzas charred by a commercial gas range, the three meteorologists and one intern debate whether the approaching cold front will bring freezing rain, sleet, or snow. Nimbus, the observatory’s gray shorthair cat named after clouds that bring precipitation, makes his presence known.
After dinner, the crew scrubs and vacuums the entire quarters, including kitchen, pantry, bathroom, bunk rooms, and living room. They’re tired but in high spirits. Snow is in the forecast. And their off week starts tomorrow after they welcome the alternating crew of observers and travel down the mountain, this time of year by pickup truck on the auto road. If the snow is deep, they’ll stop to put chains on the tires. In the back of their minds, they know the whole trip could be delayed by dense fog or high winds above tree line.
Knapp’s short dinner break ends and he heads back up to the weather room. Except for my questions, he is alone once again for a nocturnal routine he has kept for 16 years.
Just after 7:45, he gears up briskly and ascends the observation tower, opens the door beneath an A-frame protecting against chunks of rime that fly when winds accelerate, and steps onto the vast observation deck, walking in darkness to the north end. He counts two layers of clouds below and three aloft.
The meteorologist heads to the designated spot for measuring ambient air temperature, turns his headlamp on, and spins the sling psychrometer, a low-tech instrument that’s reliable in a variety of extreme conditions. This manual weather observation process has been happening the same way, every hour, since 1932. With side-by-side dry-bulb and wet-bulb thermometers, measurements are used to calculate dew point and relative humidity, the amount of water vapor in the air.
During the next ob, he climbs three flights of stairs and ladders to the top of the observation tower, perched in darkness above anywhere attached to earth in the northeastern U.S. He checks the heated anemometers and, if needed, removes ice that accumulates fast as winds accelerate and temperatures plummet. Tonight, it’s only hovering around freezing with winds gusting at 50 mph.
Heading inside, he closes the hatch at the top of the tower, quieting the west winds blowing out of the chasm of the Ammonoosuc Ravine against Mount Washington’s windward flank, and again returns to the weather room to log data, check radar, and perform other tasks until he heads outside again regardless of the weather, repeating this routine through the night.
Asked if the work ever gets monotonous, he says no. The weather is ever-changing, and knowing his work continues the 90-year data set steels his sense of purpose.
“It’s almost like having the mountain to myself,” he says. “I only have to worry about the weather.”
Data is inputted after every hourly observation through the night. 
A playlist and mug of coffee also keep him going. He responds to a question on MWOBS’ Facebook page about yesterday’s photo of a cap cloud that formed over the summit. Knapp doubles as the observatory’s photo administrator, and his summit photography has attracted a colossal following.
He’s known at the summit for rating sunrises on a scale of one to ten. A three on his scale is likely an eight or nine on ours.

But from now until early March, he’ll go to sleep before sunrise, missing the morning blue hour.

It’s approaching 1:00 a.m. and the meteorologist starts a synoptic observation, a six-hour detailed snapshot of conditions. He records maximum and minimum temperature, atmospheric pressure tendency, and precipitation types and totals. This all gets delivered to the National Weather Service. Being prompt matters. The synoptic data feeds weather models that Mount Washington’s observers and many other meteorologists rely on for accurate forecasting.
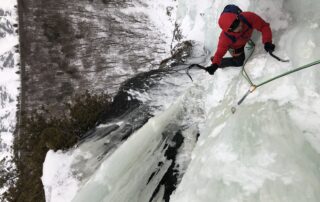
The complexity of his work increases after the 1:00 synoptic. He starts to work on the daily mountain forecasts between 2:00 and 3:00, staying keenly aware of the observatory’s backcountry audience. The Mount Washington and Higher Summits forecasts need to be posted on mountwashington.org before 5:00 a.m. The weather is always changing and the stakes are high. Search and rescue teams, climbing guides, and others rely on MWOBS’ forecasting accuracy, helping them decide when to head out, how to modify plans, or to postpone.
After a few hours of sleep in one of the cozy wood-paneled bunk rooms, I head back to the weather room and overhear Knapp recording his voice for the audio forecast. Falling snow is starting to accumulate at 5:15 when Weather Observer Sam Robinson arrives in the weather room to start his day. He fields a round of probing, collegial questions from Knapp about data points entered the previous day. It’s all part of keeping the record straight.
Knapp and Robinson stay composed as ever. With winds on the increase and a snow storm in process, care will be needed on this shift change day as the next crew makes their way to the alpine zone for another challenging week at the weather station.
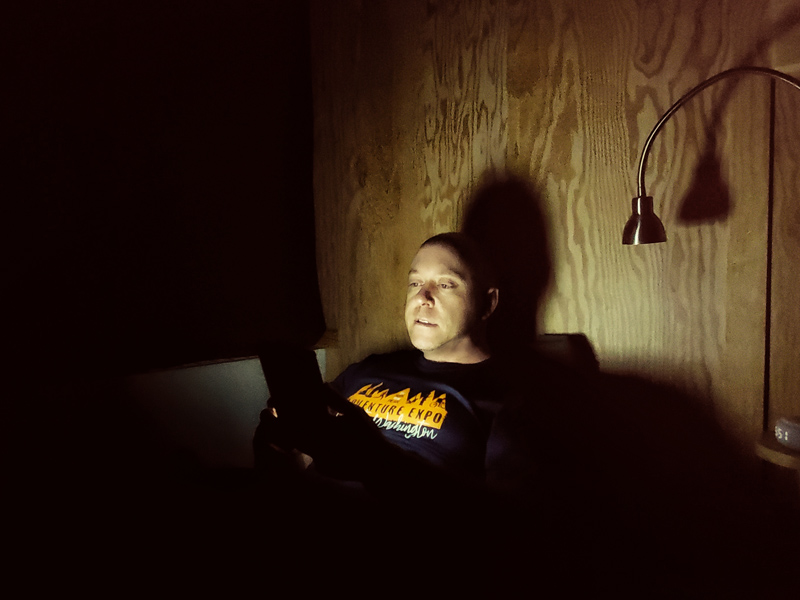
Knapp reads in an observatory bunk room after completing his nightly shift. 
If you value our work, consider a donation to Mount Washington Observatory, a private, nonprofit institution. Donations directly support the continuation of forecasting, climate data, and educational work at the summit of Mount Washington. Any donation qualifies you as a member. $5 per month gives you a one-year subscription to Windswept, our member magazine where this story was originally published.
About the Author
Charlie Buterbaugh is the Director of Communications at Mount Washington Observatory.

Share This Post

Support Us

Mount Washington Observatory is a nonprofit research and educational institution working to advance understanding of Earth’s weather and climate.

We cannot do this without your support!

November 2021

New Normals Reveal Valley and Summit Temperature Increases, Among Other Climate Trends

New Normals Reveal Valley and Summit Temperature Increases, Among Other Climate Trends

By Brian Fitzgerald, Director of Science & Education | November 15, 2021

Chances are, you’ve heard a meteorologist refer to weather conditions as near, above, or below “normal.”

But just what is normal for where you live? Who gets to say? How is it even determined?

Every 10 years, the National Centers for Environmental Information [(NCEI) formerly known as the National Climatic Data Center] are charged with generating climate statistics known as U.S. Climate Normals, based on requirements from the World Meteorological Organization (WMO) and National Weather Service (NWS).

These statistics are calculated for thousands of locations throughout the country, across a uniform 30-year period, and serve as a baseline to compare against weather forecasts just like the one you might have seen today. Statistics such as daily, monthly, seasonal, and annual averages of temperature, precipitation and other climate variables are computed for roughly 15,000 stations nationwide, including the summit of Mount Washington based on weather data transmitted from Mount Washington Observatory (MWO) staff. With the anticipated release of the new normals in late spring 2021, MWO staff naturally wondered: what has changed?

As countless investigations such as the US National Climate and IPCC assessment reports have shown, a warming planet has led to climate changes throughout the entire globe, with regionally specific trends. Changes unique to Mount Washington, as shown by Murray et al. (2021, “Climate Trends on the Highest Peak of the Northeast: Mount Washington, NH”) include elevation-dependent warming rates over many decades. With this in mind, many were curious: What if any evidence of climate change could be seen by comparing the 1981-2010 and 1991-2020 climate normals, even though these two datasets have 20 over-lapping years between them.

To help us answer some of these questions, our summit interns, with guidance from NH State Climatologist Mary Stampone (a MWO trustee) and myself, took on the investigation this past summer to help us understand not only what may have changed on the summit (KMWN, 6,288 ft.), but also up and down the Mount Washington Valley at sites including Pinkham Notch Visitor Center (GHMN3, 2,025 ft.) and North Conway Village (NCON3, 522 ft.). As the interns began to compare each station’s 1991-2020 climate normals set versus the older 1981-2010 set, three broader stories began to appear:

An increase in annual average temperature, with variation among the three sites.

As shown in the data table below, all three sites saw annual average temperatures increase in the new normals, with North Conway showing evidence of warming every single month of the year. All told, the annual average temperature at North Conway is +1.6F degrees warmer than the previous set of normals. Mount Washington’s annual average temperature warmed +0.7F degrees, while Pinkham Notch saw a nearly even split between months that warmed or cooled in comparison, making an annual average temperature that warmed just +0.2F degrees.

Table 1. Mean average monthly and annual temperatures for KMWN, GHMN3, and NCON3, New Hampshire, for 1991-2020 (with comparison to the prior 1981-2010 normals).

An increase in annual average snowfall, particularly later in the season.

When comparing the three sites and their relative changes in annual snowfall, Pinkham Notch surprisingly saw the largest increase for total snowfall. Among the sites, Mount Washington now averages 281.8 inches annually, with Pinkham averaging 135.8 inches, and North Conway 84.0 inches. Pinkham’s increase to 135.8 inches annually is now 9.7 inches higher than in the previous normals, versus 4.0 inches more in North Conway and just 0.6 inches more on the summit of Mount Washington.

In addition to the variations among the three sites, it was notable that within the snow season, all three stations saw an overall increase in snowfall in February (see Figure 1.). This increase across the board slightly later in the snow season is worthy of a closer look to understand how the nature of our winters are changing, and what the impacts may be to the region’s snow packs.

Figure 1. Change in liquid equivalent snowfall at KMWN, GHMN3, and NCON3 between the 1981-2010 and 1991-2020 climate normals.

Changes in precipitation varied drastically among the three stations.

Finally, when comparing the three stations’ new precipitation normals versus the prior set, fairly noticeable variation throughout the year, and from station to station, seems to appear. Overall, precipitation dipped more than five inches annually on average at Mount Washington, while Pinkham Notch gained almost five inches, and North Conway saw a marginal annual increase of 0.5 inches (see Figure 2.).

Figure 2. Change in precipitation at KMWN, GHMN3, and NCON3 between the 1981-2010 and 1991-2020 climate normals.

One area of consistency among the three stations appeared in October, where a general increase in average precipitation totals was observed. From a meteorological perspective, the team was unable to complete a forensic investigation of particular storms or weather patterns in the 2011-2020 timespan that may have accounted for this increase; however, best guesses at this stage may point to an increase in the intensity or perhaps even frequency of extreme precipitation events from coastal, bomb-cyclone type nor’easters.

All together, the investigation comparing the new climate normals versus the prior set across the Mount Washington Valley has uncovered some broad-based differences and a number of lingering questions. Future investigations into these datasets could shed light on precisely what, if any, shifts in the snow season may be occurring, and how such changes may differ across a variety of mountainous terrain and elevation.

Although this investigation was a comparison of two largely overlapping datasets, versus an analysis of longer-term climatological data, the research conducted by our summit interns has given MWO a clearer understanding of what our “new normal” on the summit of Mount Washington is. If you’re curious to learn what your “normal” weather is in your backyard, we encourage you to visit ncei.noaa.gov to search for climate normals near your town. Additionally, to learn more about MWO’s recent climate normals project and read the summary report, visit mountwashington.org/research.

MWO Observers Jay Broccolo and Sam Robinson, and MWO summer interns Alexandra Branton, Michael Brown, Madeline DeGroot, and AJ Mastrangelo contributed to this story.

Share This Post

Support Us

Mount Washington Observatory is a nonprofit research and educational institution working to advance understanding of Earth’s weather and climate.

We cannot do this without your support!

Partnerships Key to Continuous Mesonet Operation

Partnerships Key to Continuous Mesonet Operation

By Peter Gagne, Technology & Operations Manager | November 15, 2021

An AMC helicopter airlifts 150-pound batteries plus other heavy items to Mizpah Spring and Lakes of the Clouds huts on Sept. 13.

Ringo Starr was mostly the silent, steady figure in the Greatest Band of all Time, but one line from a Beatles’ song that featured his vocals is particularly pertinent to our topic: “Oh, I get by with a little help from my friends.”

During my time at the Observatory, we have partnered with many businesses, organizations, and universities to support our Mount Washington Regional Mesonet (MWRM). These include Campbell Scientific, Vaisala, Taylor Engineering, Boston Dynamics, Plymouth State University, UNH, MIT, UMass Lowell, and even our local Kennett High School machine shop class. Most of the local ski areas have been instrumental in situating mesonet sites at elevation. Sites are also provided by the Cog Railway, Mount Washington Auto Road, and private landowners such as the Progins in Jackson on top of old Tyrol Ski Area.

I’d like to focus on one partner in particular, the Appalachian Mountain Club (AMC).

MWRM, our multi-site connected series of weather stations, would not be possible without AMC’s permission and cooperation. Some of the earliest mesonet stations were installed at their Mizpah Spring Hut, Lakes of the Clouds Hut, the Hermit Lake Shelters, and the Highland Center. These sites were already operating prior to my start at the Observatory in August 2010, although in some cases they were not fully completed. I was the “new guy,” replacing my predecessor Brian Forcier, and I was crazy jealous to hear of helicopter trips to transport tower sections and heavy equipment, arranged courtesy of AMC staff. Perhaps someday, I’d get the chance to “fly like an eagle.”

Much of the MWRM was funded by grants obtained in partnership with AMC. The Obs was operating under the three-year Alpine Project when I started. It was a multi-pronged approach to expand our mesonet, developing a web-based system for data display and educational modules, such as distance learning via teleconference, outreach through use of new displays, Edutrips, presentations, guest speakers, and articles in membership publications. Needless to say, there were many people involved from many departments across both organizations.

In all symbiotic relationships, there is give and take. In addition to providing historical weather data for AMC’s internal research, our interactive system provides access to live information beyond temperature, humidity, and wind at their hut locations. We also monitor their solar arrays and battery voltage in real time. This way, they know in an instant if there are any problems. In some cases, we have installed and operated specific weather instruments at AMC’s request. Examples include ground temperature sensors at ARVP 5,300 and an ozone counter at the Cog Base, among many others.

In fall 2021, our mesonet team was tasked with providing our own solar power at Mizpah and Lakes huts. We had been operating on AMC’s solar arrays at both of these sites since they were established, but they have been slowly switching from lead-acid to lithium-ion batteries, which provide an infinitely more stable power output, but cannot be charged below 32 degrees. That obviously is a problem in the White Mountains, so we had to devise a solution.

Working together with Tom Siedel, Seth Quarrier, and David Evankow, we came up with a plan that does not require us to install new exterior solar panels. Adding anything on the outside of the huts requires Nation-al Forest approval, and that can take years in some cases. So they are allowing us to tap into their existing photovoltaic array, as long as we have our own charge controller and batteries separate from their system.

Technology & Operations Manager Pete Gagne, right, helps an AMC staffer prepare for the airlift.

We purchased a Midnite Solar “The Kid” charge controller and a Sunwize 240 amp/hour AGM battery for the job. Lots of wires, connectors, conduit, hangers, and other hardware make quite a load, and we’re grateful to AMC for helping with logistics to get every-thing to the remote sites.

Some may have noticed that data from Lakes of the Clouds hasn’t been displaying for quite some time. The old radio failed, and the last spare we had was no good, so we decided it was time to replace all of the radios on the west-ern side of the Observatory with newer, faster ones. We hope to complete this work before winter.

With AMC’s support, we will keep the lights on (figure of speech) and the data flowing from these sites.

The Mount Washington Regional Mesonet is comprised of more than a dozen remote weather stations, each needing continuous monitoring and maintenance to capture weather conditions across the varied White Mountains terrain.

1111, 2022

Higher Summits Forecast Keeps Climbing School Leader in the Know

November 11th, 2022|

Paul McCoy guides ice and rock climbing, mountaineering, and ski outings in the White Mountains. He relies on Mount Washington Observatory forecasts to anticipate weather and keep people safe in the backcountry. If you value these forecasts, consider supporting our mission. Long before reaching treeline, Paul McCoy

Share This Post

Support Us

Mount Washington Observatory is a nonprofit research and educational institution working to advance understanding of Earth’s weather and climate.

We cannot do this without your support!

Weather 101: Tropical Storms

Weather 101: Tropical Storms

By Nicole Tallman, Past Weather Observer & Education Specialist | November 15, 2021

An example of a hurricane’s eye and surrounding eye wall, where the most ferocious winds of the storm occur. NOAA photo. 

Come late summer and early fall, we begin to hear more about activity in the tropics. The threat of hurricanes becomes more prominent and you may find yourself thinking about how and why these storms are forming.

One of the strongest storms known to people, a hurricane begins its life cycle as a cluster of thunderstorms in the tropical or sub-tropical waters. These waters tend to be their warmest in the late summer after intense summer sunlight has been beating down for several months. The air surrounding the surface of the water begins to heat up, evaporating some of the moisture from the ocean. This is the initial ingredient needed to begin building a thunderstorm.

Once the air is warm and moist, it begins to rise through the cooler atmosphere. The ideal set up for developing strong storms is when the atmosphere is cool, yet the ocean waters are still warm. Moving into early fall, the oceans hold on to their warmth and the air begins to cool, creating “instability” for the warm moist air at the surface of the ocean. The air continues to rise in the atmosphere, creating a thunderstorm.

The ocean continues to warm the air closest to the water’s surface and in turn, feeds the rising pocket of air. This allows for low-pressure to form because the air is rising up higher into the atmosphere. Low-pressure centers in the Northern Hemisphere rotate counterclockwise, and in the development of a hurricane, you will start to see the cluster of thunderstorms become more organized and even begin to rotate.

Once the system has its own cut-off low-pressure system, winds will begin to increase, creating a stronger storm. Once winds reach 39 mph the storm gets the label of a tropical storm, and they become a hurricane at 74 mph.

The categories of a hurricane on the Saffir Simpson scale are wind-dependent, and as the storm produces higher and higher winds, it can increase itself to a category 5 hurricane, the strongest storm known. A very indicative physical feature of a strong hurricane is its eye. This is the calm center of the low-pressure system where winds die down and rain ceases. However, surrounding the eye is the eye wall, which has the most ferocious winds of the storm. Very strong hurricanes will develop this eye, which can clearly be visible from satellite, like in the example below.

A few hazards of hurricanes include the devastating wind speeds, storms surge, very strong thunderstorms and even tornadoes imbedded in the rain bands of the hurricane.

Most of these hazards dwindle once a hurricane makes landfall and is no longer over its main energy source, the warm ocean waters. However, hurricanes that have weakened or died out can continue to impact the weather of surrounding areas and areas “downstream” from the storm.

The immense amount of moisture and energy from hurricanes have been known to make their way from areas such as the gulf or southern east coast of the U.S. all the way to the Northeast. While it is less common for areas in New England to receive a direct impact of a hurricane, we quite frequently will get saturating rains, elevated winds, or a round of very inclement weather due to the remnants of tropical storms and hurricanes.

One recent example is Hurricane Isaias, which occurred in August 2020. Isaias made landfall on the coast of North Carolina with wind speeds sustained near 85 mph. It caused significant storm surge, and multiple tornadoes at landfall. Once on land, the storm weakened to a tropical storm and continued to impact cities such as New York and Philadelphia.

Remnants eventually made their way all the way north to the summit of Mount Washington, where the crew experienced heavy downpours and a max gust wind speed of 147 mph, a new record wind speed for the month of August.

In his blog dated August 5, 2020, Weather Observer Sam Robinson wrote, “Suddenly at 8PM sharp, the chart spiked showing a gust of 147 mph! The wind database was cross referenced and sure enough, it showed a peak gust of 146.7 mph from the southeast! Our crew celebrated the feat as it set all of our personal records and we then shared the news with the state park crew who also had a few new personal records set. We soon discovered that besides personal records, it also set a new all-time wind record for the month of August! The previous record was 142 mph set back in August of 1954.”

Massive and intense, tropical storms can impact areas all the way from their development to far past their site of landfall.

1111, 2022

Higher Summits Forecast Keeps Climbing School Leader in the Know

November 11th, 2022|

Paul McCoy guides ice and rock climbing, mountaineering, and ski outings in the White Mountains. He relies on Mount Washington Observatory forecasts to anticipate weather and keep people safe in the backcountry. If you value these forecasts, consider supporting our mission. Long before reaching treeline, Paul McCoy

Share This Post

Support Us

Mount Washington Observatory is a nonprofit research and educational institution working to advance understanding of Earth’s weather and climate.

We cannot do this without your support!

The Science Behind Nor’Easters

The Science Behind Nor’Easters

The Science Behind Nor’Easters

Extra-Tropical Cyclones and the Extreme Weather they Make on Mount Washington

The Feb. 25, 2019 Hays Chart shows a 171 mph wind gust, caused by the passage of an ETC and the development of a secondary area of low pressure, which is characteristic of a nor’easter.

Unique beasts known for punishing weather, nor’easters serve an important purpose for our globe despite their infamous reputation.

A type of extra-tropical cyclone (ETC), nor’easters get their colloquial name from unique localized characteristics, mainly the coastal northeast flow that occurs before the onset of the storm, which often portends snowfall, coastal high surf, and high winds.

The factors influencing the paths of these beautiful and destructive systems are similar. Serving a critical purpose, ETCs and nor’easters redistribute heat energy from the tropics to the poles.

The earth, engineered to seek equilibrium, uses ETCs as a synoptic-scale (massive) temperature and moisture regulating mechanism. Irregular heating and our spinning sphere prevent total equilibrium, yet the earth accomplishes its need to redistribute energy.

Figure 1: General circulation of air from equator to poles and poles to equator. COMET® Program graphic.

As seen in Figure 1, heat rises from the equator and lifts north. The airmass, as it reaches the poles, cools and then sinks to the surface, heading south to start the process over again. As heat rises and lifts from the equator, and the other air masses cool, descend, and travel south, they eventually meet in the mid-latitudes.

At 44.17°N, Mount Washington’s latitude is less than 1° away from the exact middle point between the North Pole and equator. The position of the Presidential Range relative to the Atlantic Ocean, which is a considerable distance, and the elevation of the peaks, put the White Mountain summits in prime position to experience some intense winds and snowfall rates from ETCs.

When combined with the orographic (how mountains alter weather), wedge set-up of the Presidential Range, ETCs and nor’easters have produced some of the most extreme weather events experienced on Mount Washington’s summit.

Extreme wind events in Mount Washington Observatory’s (MWO) history that were caused by the passage of an ETC and the development of a secondary area of low pressure, which is characteristic of a nor’easter, include the fastest wind speed ever directly observed by people on April 12, 1934 at 231 mph.

During a recent wind event on February 25, 2019, observers recorded a gust of 171 mph, caused by a set-up similar to the 1934 World Record Wind. While the secondary low is a characteristic phenomenon of a nor’easter, the secondary development usually merges and overtakes the primary low or forms as a single entity in the Mid-Atlantic and moves northeast along the coast.

Observers were glued to the Hays Chart on February 25, 2019

It is important to note that the most extreme wind events experienced on Mount Washington were not caused exclusively by nor’easters. They exhibited many nor’easter features, but in these cases, a deep upper-level wave, commonly cut off from the polar vortex, was intense enough to cause an anomalously deep wave in tropopause pressure.

In early March 2021, such a system brought high winds gusting at 147 mph to the summit along with some of the coldest temperatures of winter 2021. The temperature dropped to –28°F. With sustained 130 mph winds, wind chills plunged to 80°F below zero. Meanwhile in the valley, power and heat outages as well as significant damage occurred, including a downed tree in the Observatory’s North Conway office parking lot.

ETCs, also referred to as mid-latitude or wave cyclones, develop as air masses mix in an attempt to dynamically bring about equilibrium of temperature, moisture, and pressure. When the two air masses meet, fluids are deflected to the right (or left in the southern hemisphere) due to the Coriolis effect. This creates counter-clockwise rotation around an area of low pressure.

ETCs are a type of cyclone, which are synoptic-scale low-pressure systems that occur in the mid-latitudes, generally between 30°N and 60°N. They are responsible for a majority of the inclement weather across the globe, especially along the boundary between an eastern continental landmass and a western coast of an ocean.

All nor’easters are ETCs, but not all ETCs are Nor’easters. In the U.S., ETCs tend to affect the northern half of the country as Alberta Clippers and commonly make their way to New England. Nor’easters affect the eastern coastline with particular focus on the Mid-Atlantic and New England. Sometimes, there is a combination of the two, and even cases where systems merge. The previously mentioned record wind gusts measured by MWO all resulted from merging systems. Strong and deep tropospheric waves affected the stratosphere, destabilizing the jet stream and allowing the polar vortex to destabilize and detach.

These systems are not to be confused with tropical cyclones (hurricanes). Extratropical and tropical systems can and sometimes do look strikingly similar on satellite, but differ in some very distinct ways. Arguably the most visible and notable contrast between the two is the comma-shape extension of an ETC that commonly extends to the south along the cold front of the system. ETCs also lack a closed eyewall typically observed in tropical cyclones.

Dynamics wise, the development and evolution of ETCs involve strong temperature and moisture gradients between air masses, known as baroclinic zones, which is why these systems are also called baroclinic cyclones. As a mid-to-upper-level wave approaches such a zone, the two air masses begin to mix and the process of cyclogenesis ensues. This is in contrast to tropical cyclones, which are more vertically surface-based, non-frontal, and develop from convection over warm ocean waters in low horizontal wind shear (gradient) environments.

Every ETC is an individual. Despite each storm’s unique features, they do have many similarities, generally forming along boundaries of differential air masses where temperature and moisture gradients occur with significant vertical wind differences (shear). Cyclogenesis occurs along baroclinic zones near an area in the jet stream where winds are the highest. Known as jet streaks, these areas happen in the atmosphere’s lower and upper levels.

Lower-level jets tend to pass at elevations around the summit of Mount Washington, assigning the Observatory an important responsibility of measuring jet streak velocities.

As the cyclone progresses, the cold front rotates counterclockwise and moves around the back of the cyclone with denser, cooler, and drier air. Meanwhile, the associated warm front progresses more slowly. The warm front’s air mass has to fight gravity as it lifts and mixes into a cooler air mass ahead of the system. As the cold front sweeps around, the denser air undercuts the less dense, warmer, and more humid air, forcing air aloft as well. Later, when the cold front meets and mixes with the warm front, the cyclone begins to occlude.

Occlusion is when the cold air mass overtakes the warm front and becomes cut off from the center of the low by being blocked off by the cold air. Colder air begins to fill the air column, replacing the warm, humid air which causes the system to weaken. Cold air in the column prevents lift and decreases the temperature gradient enough for the cyclone to become barotropically cold. The system becomes stacked and collapses on itself until it dissipates along with the frontal systems associated with the ETC.

Atmospheric pressure can fall very rapidly when there are strong upper-level forces on the system or there is extreme latent heat release as a system moves from a dry continental air mass to a moist oceanic air mass.

When the pressure falls faster than 1 MB (0.030 inHG) per hour, the process is called explosive cyclogenesis or bombogenesis, and these tend to be the nor’easters well known in the Northeast.

Having discussed the life cycle of an ETC, what makes nor’easters different from other ETCs? The difference lies in the track plus the heightened potential of a nor’easters to undergo explosive cyclogenesis due to the geographic set-up of North America. Commonly, areas of low pressure form on the lee side of the Rocky Mountains as an upper-level wave feature crosses over the range, then meets the warm, humid air lifting north from the Gulf of Mexico.

The upper-level troughs in the jet stream tend to dip farther south than the wave features that form Alberta Clippers. The Gulf of Mexico is a very warm body of water that helps feed the Gulf Stream, which moves northeast along the eastern seaboard. Some of these areas of low pressure that come off of the Rockies deepen as convection kicks off, and heat energy is absorbed by what could develop into a nor’easter. As the beginning of the system moves over the Appalachians around the Mid-Atlantic states, it becomes compressed and spreads out to deepen again on the Appalachians’ lee side.

Having said that, an interesting feature also tends to occur on the windward side, and this can be unique to North America, similar to the injection of warm, humid air from the gulf. The cold air descending from the north gets wedged between the Appalachians and the East Coast in a process called cold air damming. Ultimately, the damming can enhance baroclinicity in the lower levels and often form a secondary area of surface low pressure separate from the initial trough and wave feature.

This newly developed center of surface low pressure begins to rotate as warm air is pushed east and absorbs moisture from the warm Atlantic waters. Because of the heightened baroclinicity and the amount of potential energy that warm surface waters of the coastal Atlantic store and can release, explosive or rapid intensification occurs.

With the arrival of another winter in the White Mountains, Mount Washington will undoubtedly be treated with many ETCs and hopefully some more high winds, cold temperatures, and snow from nor’easters.

By Jay Broccolo, Weather Observer & Meteorologist | November 15, 2021

1111, 2022

Higher Summits Forecast Keeps Climbing School Leader in the Know

November 11th, 2022|

Paul McCoy guides ice and rock climbing, mountaineering, and ski outings in the White Mountains. He relies on Mount Washington Observatory forecasts to anticipate weather and keep people safe in the backcountry. If you value these forecasts, consider supporting our mission. Long before reaching treeline, Paul McCoy

Share This Post

Support Us

Mount Washington Observatory is a nonprofit research and educational institution working to advance understanding of Earth’s weather and climate.

We cannot do this without your support!

June 2021

Avalanche Deaths a Tragic Part of Mount Washington History

Avalanche Deaths a Tragic Part of Mount Washington History

By Peter Crane, Curator, Gladys Brooks Memorial Library | June 15, 2021

Mount Washington and Ammonoosuc Ravine (looking from the west). The large dot marks the approximate site of the Forgays tragedy. Bradford Washburn photo.

On Monday February 1, 2021, an avalanche in Ammonoosuc Ravine took the life of Ian Forgays, 54, of Lincoln, Vermont.

Forgays, a very experienced backcountry skier, was skiing alone in this ravine on the western side of Mount Washington. Weather conditions were favorable with the temperature in the single numbers and teens and winds averaging 33 miles per hour that day. The Mount Washington Avalanche Center had issued a “low” rating for avalanche danger, but it is important to under-stand that low hazard does not mean no hazard, and even when such hazard is minimal, it is not unusual for areas of unstable snow to exist in some locations. As the Center’s forecast for the day stated, “the potential for small avalanches of wind drifted snow remains in isolated areas at mid and upper elevations.”

Presumably Forgays skied onto such an unstable pocket, which released and carried him downward. To compound his predicament, the spot lay in a “terrain trap” — an area where a broader slope of snow could slide downward into a tighter, funnel-like constriction, resulting in relatively shallow snow piling up into a deep mass over the skier. This was a mass from which he could not escape; new snowfall the next day, with a subsequent avalanche, buried him only deeper.

Friends of Forgays alerted authorities to his absence late Tuesday. On Wednesday, a full field search commenced, focused on Ammonoosuc Ravine. Forgays had been using an avalanche transceiver, or beacon—a small device that sends out an electronic homing signal which can be received by another such device—which was essential in locating him. His signal was acquired at about 4:30 p.m.; it would take more than an hour and a half to dig through almost 13 feet of avalanche debris to reach him. By then Ian Forgays had succumbed to asphyxiation.

The search and recovery effort included personnel from the New Hampshire Fish and Game Department, the White Mountain National Forest/Mount Washington Avalanche Center, and the all-volunteer Mountain Rescue Service.

The Mount Washington Avalanche Center issued a detailed incident report, assessing the snow conditions and considering the decisions made by Forgays. The Center noted that Forgays was a very capable and accomplished skier, and such skiers, honed by experience, sometimes accept calculated risks. Unusual circumstances can cause those calculations to go awry, to the adventurer’s peril. In this case, the Center stated, “skiing technical lines, in a thin snowpack above a notorious terrain trap, with no partners, even on a Low danger day, raises the stakes tremendously.” We send our condolences to Forgays’ family and friends.

According to available records, 17 people have died in avalanche incidents on Mount Washington; this number does not include others who have been caught, buried, or injured by such snow slides on the mountain and who have lived to tell the tale.

The first two people who died in an avalanche-related incident on Mount Washington were Philip Longnecker, 25, and Jacques Parysko, 23, who died in January of 1954 while camping in an igloo-like snow shelter built imprudently just beneath the Tuckerman headwall. Their shelter was hit by a small snow slide, burying Longnecker and leading Parysko to attempt an escape by hiking ill-prepared down the Sherburne Ski Trail, where he succumbed to hypothermia.

Another early avalanche victim was Aaron Leve, 28, who was hiking in Tuckerman Ravine in February of 1956. He was with four others who were struck by the snow slide—indeed one probably triggered it—but he alone was fully buried, and it took an extensive effort to locate his by-then-lifeless body.

Following those incidents, it seems that all such tragedies involved either skiers or climbers—the latter including technical ice climbers as well as non-technical winter climbers on Lion Head.

As noted earlier, Ian Forgays, 54, died in an avalanche in Ammonoosuc Ravine in February of this year. His was the first such incident on that side of the mountain. Perhaps surprisingly, no skier has yet died in an avalanche in Tuckerman Ravine. Three skiers have died in such incidents in the aptly-named Gulf of Slides— John Wald, 35, and his companion Todd Crumbaker, 29, in one avalanche in March of 1996, and David McPhedran, 42, in January 2000. More recently, Nicholas Benedix, 32, died in an avalanche in April 2019 while skiing down the Ravine of Raymond Cataract, a not-so-often skied route lying on the east side of the mountain, between Tuckerman Ravine and Huntington Ravine.

Mount Washington from the east (from atop Wildcat “D” peak). The summit of Mount Washington is in the clouds, as is so often the case. From left to right can be seen the Gulf of Slides, Tuckerman Ravine, the Ravine of Raymond Cataract, and Huntington Ravine, each of which has been the scene of one or more avalanche fatalities.

Mountaineers venturing onto the steep slopes of Huntington Ravine, favored by technical ice climbers, have come to grief when unstable snow perched precariously in that precipitous terrain has overcome them. In February 1964, Hugo Stadtmüeller, 28, and John Griffin, 39, lost their lives as a result of such a snow slide. Thomas Smith, 41, succumbed to an avalanche in Huntington in February 1991; his climbing companion was injured but survived. Peter Roux in January 2018, and Jimmy Watts, 24, in March 2013, were solo climbers who died as a result of avalanches in this ravine.

In early winter it is not unusual for ice climbers to ply their craft on the headwall of Tuckerman Ravine, and two such climbers, Scott Sandberg, 32, and Thomas Burke, 46, in separate parties, were lost to an avalanche in November of 2002, in an incident that involved seven individuals.

The slopes of Lion Head, one of the standard not-so-technical routes for winter ascent of Mount Washington, have been the scene of avalanche tragedies as well. In January 1982, Albert Dow, 28, a volunteer from the Mountain Rescue Service, lost his life while serving in the search for two missing climbers. In January 1996, Alexandre Cassan, 19, died while attempting an ascent of the mountain via Lion Head.

Of Mount Washington’s avalanche toll, five were skiers, seven were technical climbers, and five were non-technical climbers or hikers. All were male. The average age of the victims was 33, with a range from 19 to 54. Two deaths occurred in November, none in December, six in January, three in February, three in March and three in April. All of these people were on the mountain for a day of enjoyment, to indulge their passion for recreating in the outdoors and rising to mountain challenges, but it was a day from which they never returned.

For those with an interest in exploring Mount Washington, or other such mountains, in winter and spring, avalanche knowledge can be a prerequisite for safe adventures. Especially if you have an enthusiasm for skiing the steeps, or climbing challenging slopes, taking an avalanche safety course should be on your to-do list. Many climbing schools or guide services offer such instruction, from basic awareness sessions to detailed technical courses in snow science and rescue coordination. Even with such training under your belt, sometimes “a little knowledge can be a dangerous thing,” and humility and acknowledgement of what you don’t know about the complicated subject of avalanches should remain a guiding principle. (Renowned Swiss guide André Roch once reminded a group of his colleagues, “It is good you are all experts. But the avalanche, it does not know that you are experts!”) Check, and strive to understand and abide by, the avalanche forecasts issued by the Mount Washington Avalanche Center. Don’t just take a look at those forecasts once in a while—read them daily through the winter, to further enhance your understanding of the evolution of the snowpack and its potential hazards throughout the snow season. Pack along “the holy trinity” of avalanche safety tools —beacon, probe, and shovel —and practice their use, realizing that speed in use of a beacon can literally mean the difference between life and death. And always remember that alluring as the powder or ice or summit may be, the mountain will be there for another day.

The waves of avalanche snow have been compared to ocean waves, in their power, but also in their tragic impact. Indeed, it should never be forgotten that, “The snowy torrents are like the deep sea: they seldom return their victims alive.”

1111, 2022

Higher Summits Forecast Keeps Climbing School Leader in the Know

November 11th, 2022|

Paul McCoy guides ice and rock climbing, mountaineering, and ski outings in the White Mountains. He relies on Mount Washington Observatory forecasts to anticipate weather and keep people safe in the backcountry. If you value these forecasts, consider supporting our mission. Long before reaching treeline, Paul McCoy

Share This Post

Support Us

Mount Washington Observatory is a nonprofit research and educational institution working to advance understanding of Earth’s weather and climate.

We cannot do this without your support!

Visibility from Summit Increasing Over Time

Visibility from Summit Increasing Over Time

By Brian Fitzgerald, Director of Science & Education | June 15, 2021

 Weather Observer Sam Robinson stands above the clouds in December 2020. Observers record prevailing visibility at each of their 24 hourly observations, every day of the year.

Visibility appears to be generally increasing over time on the summit of Mount Washington since our continuous record of visibility began in 1943.

This noteworthy finding comes in the wake of an initial data exploration and analysis of Mount Washington Observatory’s (MWO) long-term visibility records, completed by Weather Observers Jay Broccolo and Sam Robinson in Spring 2021.

The project report, entitled “A Data Exploration of Visibility at Mount Washington Observatory (1943-2020), KWMN: Key Findings” was recently published to help the public understand the background, motivation, relevance, findings and suggestions for further study.

The exploration grew out of public and staff interest initially related to the COVID-19 pandemic and its effect on the environment. Back in spring 2020, our staff fielded a number of inquiries asking if the weather observers were able to see farther than usual due to the global reductions in industry, transportation and overall aerosol emissions. It was a tricky question to answer, because in order to respond with any confidence, one would have to know what “usual” visibility is, and would certainly require a lot of visibility data over time to compare against.

For those wondering how visibility is measured in the first place, understand that MWO’s weather observers record something known as “prevailing visibility” at every single hourly observation, both day and night, by determining which known landmarks and distances that they can see on the horizon.

As the highest point in the Northeast with a treeless summit, Mount Washington’s position allows for an unobstructed view in all directions (provided you’re not in a cloud). The naked-eye view from the summit can reach up to 130 miles to Mt. Marcy in NY, for example, 79 miles to Camel’s Hump in VT, or 67 miles to the Atlantic Ocean off the Maine coast.

At night, observers use many of the same natural features plus the lights of known locations to assess the visibility. For context, most weather stations that report visibility are at airports with automated instrumentation to help pilots and traffic controllers assess take-off and landing conditions. Visibility at these stations will only report up to 10 miles as the highest value of interest.

 A map of concentric circles around the summit with visibility markers indicated. The inner-most circle is 20 miles, while the outer-most circle is 130 miles away. 

For nearly a year, Broccolo and Robinson dug into paper and digital visibility data, gathering any related information including measurement standards and observer training materials.

Two pieces of critical information were discovered early on: 1) 24-hourly visibility observations began continuously in 1943, with reporting being more intermittent previously, and 2) prevailing visibility records before 2008 exist only on paper, and digitally from 2008 to present.

Without taking on the hugely exhaustive process of manually entering data from paper forms into a digital database, Broccolo and Robinson were able to use a nearly identical visibility variable: lowest prevailing visibility. This value had been digitized along with all values on the daily B-16 Form during a recent project by observers and interns.

Lowest prevailing visibility is what it sounds like. It essentially means the lowest prevailing visibility reported in the last two observations. So if two hours ago the visibility was reported at 1/16 of a mile, and this current hour the visibility improved to 50 miles, the lowest prevailing visibility for this hour would be 1/16 of a mile. Through a direct comparison of lowest visibility versus prevailing visibility from 2008 to present, it was found that both of these variables tracked very closely, making lowest visibility an acceptable proxy.

With data in hand, Broccolo and Robinson examined seasonal and annual average lowest prevailing visibility to explore what long-term trends or anomalies may have been present. The initial analysis appears to show a steady increase in visibility first appearing in the 1950s and then increasing at a higher rate starting in the early 2000s. Public interest in whether average visibility was found to be increasing due to the COVID-19 pandemic in 2020 was not easily discernible.

 Seasonal averages of lowest visibility (miles) at KMWN (December, 1942 through November, 2020).

On average, meteorological summer (June, July, August, or “JJA” as noted on the figure 2 above) showed the lowest visibility of all of the seasons. Higher humidity levels and a more active southerly flow of air from major areas of industry may be reasons for this difference, though more analysis is needed to assess any correlation.

In future investigations, a number of different questions may be explored, including what if any difference exists between day and nighttime visibility observations, or how these visibility data compare against other atmospheric measurements such as particular matter concentrations or wind speed and direction.

“The next steps would be to analyze the data deeper and corroborate the findings with other measurements,” Broccolo said. “Further statistical analysis is required to show the quality of data. Measurements of air quality affecting particulates at a similar geographic location and elevations or the development of a measuring system at the summit of Mt. Washington would also be of interest in order to compare visibility and air quality.”

Regardless of which investigations come next, the value of MWO’s visibility dataset is immense. No other record of similar location, length, resolution or quality truly exists, which makes it a tremendous asset for studying the relationships between visibility and air quality over time in Northern New England.

Whether examined internally or through partnership, the possibilities for future work are clear to see, so to speak. Read the full project summary report.

1111, 2022

Higher Summits Forecast Keeps Climbing School Leader in the Know

November 11th, 2022|

Paul McCoy guides ice and rock climbing, mountaineering, and ski outings in the White Mountains. He relies on Mount Washington Observatory forecasts to anticipate weather and keep people safe in the backcountry. If you value these forecasts, consider supporting our mission. Long before reaching treeline, Paul McCoy

Share This Post

Support Us

Mount Washington Observatory is a nonprofit research and educational institution working to advance understanding of Earth’s weather and climate.

We cannot do this without your support!

Go to Top